CEP Multifamily Fund II
Fund Parameters
$50Mil +
Equity Fund Offering
7 Years
Anticipated Life of Fund
$250Mil
Total Capitalization
900 +
Units
CEP Multifamily Investments


$50Mil +
Equity Fund Offering
7 Years
Anticipated Life of Fund
$250Mil
Total Capitalization
900 +
Units

The Opportunity
Due to market dynamics, CEP is seeing the best buying opportunity since the Global Financial Crisis.
Specifically, we can acquire properties BELOW replacement cost today. The lower price, coupled with explosive rent growth due to a supply gap in the coming years will enable us to deliver generational risk-adjusted returns. Given this opportunistic market dynamic, we will be able to minimize risk and maximize return; effectively, buying core assets that deliver core-plus returns and buying core-plus assets that deliver value-add returns.
We apply this thesis to attainable/workforce housing in high-growth secondary and tertiary suburban markets because these markets have proven to deliver superior risk-adjusted returns relative to urban markets over multiple cycles. Suburban market returns outpace those of urban markets during downturns while keeping pace with, and even slightly outpacing, urban markets when the bull is running.
CEP has an active pipeline of deal flow, with serious consideration and diligence being applied to 10+ assets to ensure fulfillment of assets to be placed into Fund II
10.00% Preferred Return
$100K Minimum Investment
Targeted Returns vs. Targeted Investor Returns
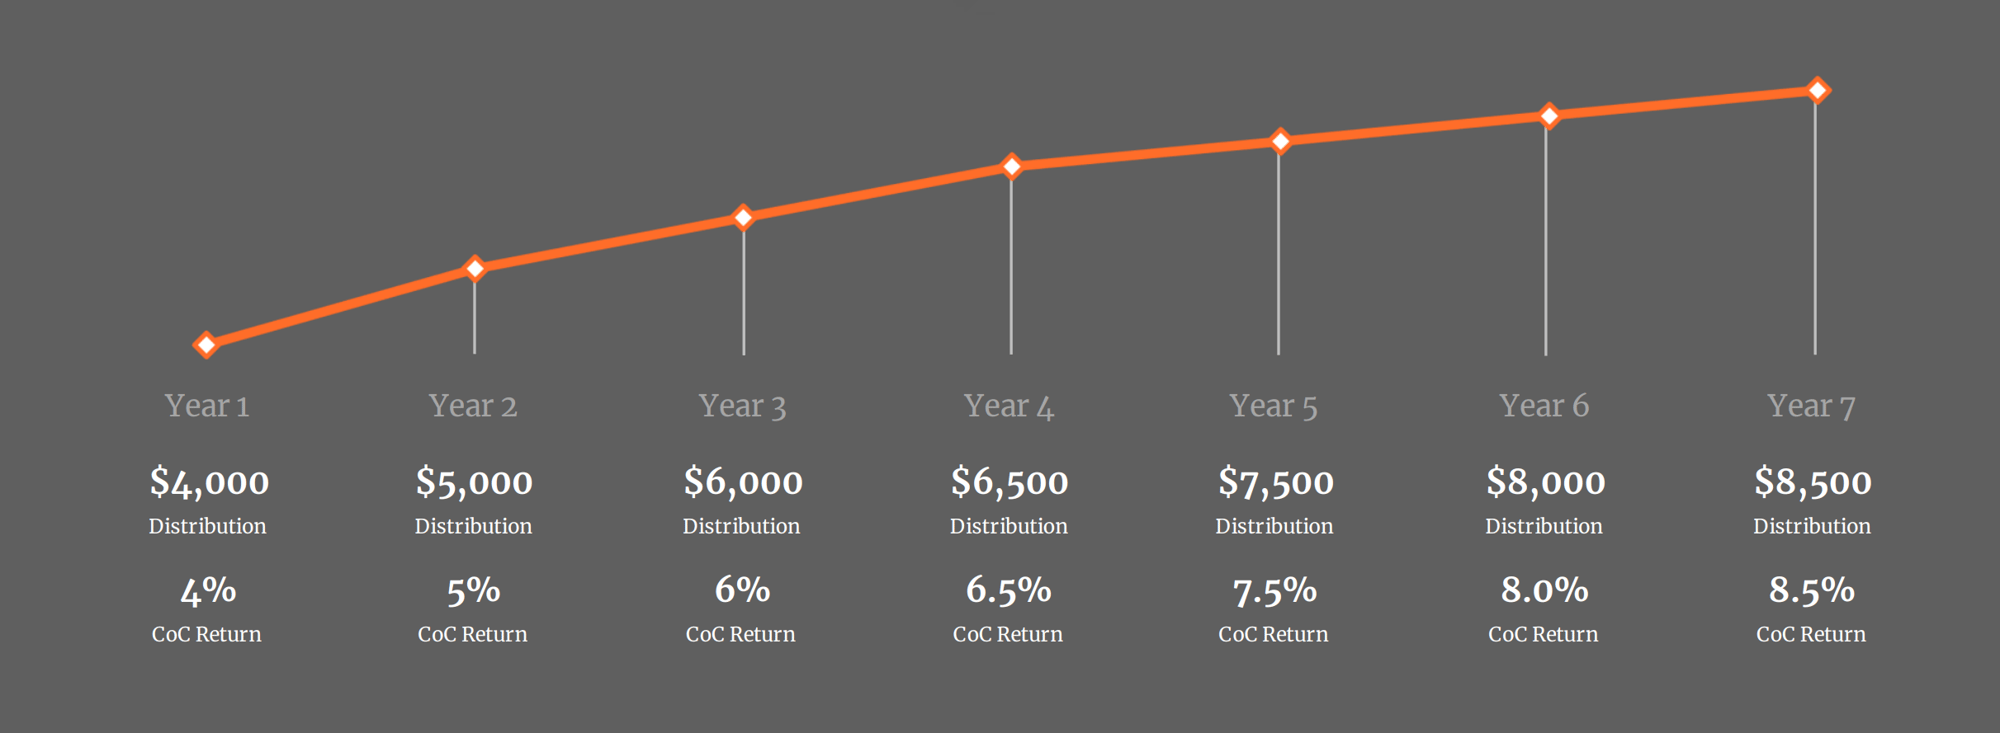
Average Annual Cash-on-Cash Return
7.5%
6.5%
Internal Rate of Return
15%
12%
Equity Multiple
3.25X
2.5X
Targeted Returns Vs Targeted Investor Returns
Average Annual Cash-on-Cash Return
7.5%
6.5%
Internal Rate of Return
15%
12%
Equity Multiple
3.25X
2.5X
Fund Lifecycle Target – 7 Years
Commitment Phase
$50M+
(Fund Formation / Capital Raising / Capital Calls)
Investment Phase
4+ Properties
(Deal Sourcing / Due Diligence / Capital Deployment)
Hold Phase
5+Years
(Asset Management / Value Creation / Exit Planning)
Exit Phase
2+ Years
(Exits / Value Capture / Winddown)
Your Fund Investment At Work
$100 K
Initial Investment
$45 K
Total Cash Flow Distributions
6.5 %
Avg CoC Return
$104 K
Realized Gain
$250 K
Total Return
2.5 X
NET Equity Multiple

Your Fund Investment At Work
$100 K
Initial Investment
$45 K
Total Cash Flow Distributions
6.5 %
Avg CoC Return
$104 K
Realized Gain
$250 K
Total Return
2.5 X
NET Equity Multiple

.webp)


